Are you wondering about the power of a solar panel per m² and how much it could produce in 2025? This is an excellent question when considering installing solar panels. Knowing how many watts a square meter can generate helps you better estimate your needs. Let’s look at this more closely, as several factors come into play to get an accurate estimate.
Key Takeaways
- The power of a solar panel per m² generally ranges between 150 and 200 Wp, but this varies depending on the technology.
- Actual production depends on many factors such as sunshine, orientation, and tilt of the panels.
- To calculate the required peak power, you need to know your electricity consumption and the sunshine in your region.
- The surface area of a standard panel is often around 1.7 m², and its electrical power is proportional to its size.
- Using a simulator and monitoring your installation’s performance will help you optimize your solar energy production.
Understanding Solar Panel Power per m²
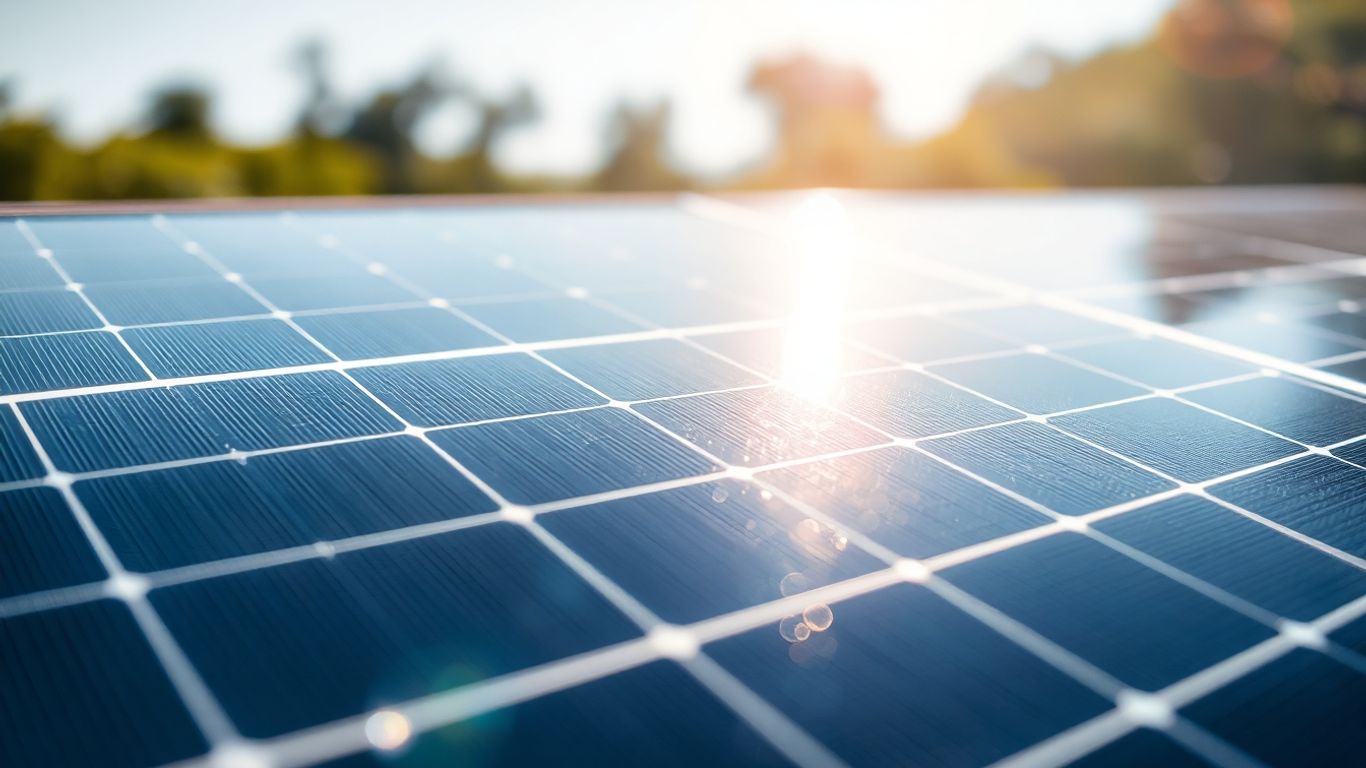
To properly understand the energy production of your future solar installation, it’s essential to grasp what solar panel power per square meter means. It’s not just a random number; it represents the capacity to convert sunlight into electricity.
Definition of Peak and Maximum Power
When we talk about solar panel power, we generally use two terms: maximum power and peak power. Maximum power is the highest level a panel can reach under ideal conditions, much like a car’s top speed. Peak power (often abbreviated as Wp for Watt-peak) is a standardized measurement. It is determined under very specific laboratory conditions: 1000 W/m² of solar irradiance, a temperature of 25°C, and an angle of incidence of 1.5 air mass. These conditions allow for objective comparison of different solar panels. It’s important to note that peak power does not correspond to the actual daily production of your installation, as real-world conditions are rarely that perfect.
Factors Influencing Electricity Production
Several elements will affect the amount of electricity your solar panel will actually produce. The panel’s technology itself is a key factor; some materials are more efficient than others. The sunshine in your region is, of course, a determining factor. A very sunny region will produce more than a region that is more often cloudy. The orientation of your panels (ideally facing south) and their tilt angle relative to the sun also have a significant impact. Even the ambient temperature can affect performance: a panel that is too hot produces slightly less. You also need to consider the energy loss that can occur during the transport of electricity to your home.
Ideal Test Conditions for Power Measurement
So that manufacturers can compare their products, they use standardized test conditions (STC). These conditions are as follows:
- Solar irradiance of 1000 W/m².
- Cell temperature of 25°C.
- Light spectrum simulating a sunny day (air mass coefficient of 1.5).
These conditions yield the peak power (Wp) you see on technical datasheets. It’s a useful measure for comparison, but keep in mind that your actual production will be influenced by real weather and installation conditions. To get a more precise idea of what you can expect, it’s advisable to use an online simulator that will take into account your location and the specifics of your roof. A typical solar panel can have a power output between 375 and 500 Wp, which can generate between 300 and 750 kWh per year [d3c2].
It’s easy to get lost in the numbers and acronyms. The main thing to remember is that peak power is a reference measure, but actual production depends on many external factors. The goal is to choose an installation whose peak power is suited to your consumption and local conditions.
Estimating the Production of a Square Meter of Solar Panel
It’s natural to want to know how much electricity a square meter of solar panel can actually produce. This question is at the heart of planning any photovoltaic installation. Although a panel’s nominal power is measured under ideal laboratory conditions, actual production varies considerably depending on many environmental and technical factors.
Average Power Produced per Square Meter
To give you a general idea, it’s estimated that one square meter of solar panel produces an average of 150 to 200 watts-peak (Wp). This value represents the panel’s maximum capacity under optimal conditions. However, it’s important to understand that these conditions are rarely met in everyday life. The average annual production per square meter generally ranges between 180 and 320 kWh. This may seem like a lot, but it will depend heavily on your geographical location and the technology of the panels used 180 to 320 kWh per square meter annually.
Estimated Annual Production per Square Meter
Annual production is a more realistic measure of a solar panel’s performance. It takes into account variations in sunshine throughout the seasons and days. For example, an installation located in the south of France will benefit from more sunshine and therefore produce more electricity than a similar installation in the north of the country. It should also be considered that temperature affects efficiency: solar cells are less effective when they get too hot.
Here are some elements that influence this production:
- Panel Technology: Monocrystalline, polycrystalline, or thin-film panels have different efficiencies.
- Local Sunshine: The number of sunshine hours per year in your region is a determining factor.
- Orientation and Tilt: Facing south and optimal tilt maximize solar ray capture.
- Shading: Even partial shade can significantly reduce production.
It is impossible to give a single, fixed value for the production of one square meter of solar panel. Each installation is unique and must be evaluated based on its specific environment.
Variability of Production by Technology
The technology of photovoltaic cells plays a major role in the power produced per square meter. Monocrystalline panels, for example, are generally more efficient than polycrystalline panels, although they may be more expensive. Thin-film panels, such as amorphous silicon, have lower efficiency (between 6 and 9%), but can be more flexible and suitable for certain applications. The choice of technology will therefore directly impact the amount of energy you can expect from your solar installation.
Calculating the Required Peak Power for Your Installation
To know how much solar power you need to install, you first need to look closely at your electricity consumption. This is the basis for all calculations.
Determining Daily Electricity Consumption
Before thinking about panels, you need to know how much electricity you use each day. Look at your electricity bills from previous years to get an idea of your average annual consumption. Divide this figure by 365 to get your daily consumption. For example, if you consume 4,000 kWh per year, that’s about 11 kWh per day. This is an important first step.
Taking Minimum Sunshine into Account
It’s not enough to look at your consumption; you also need to consider the times when the sun is least present. Generally, sunshine data from December is used, as it is often the least sunny month of the year. This ensures that your installation can produce enough even during the darkest periods. Sunshine varies greatly depending on your region. For example, the south of France receives more sun than the north.
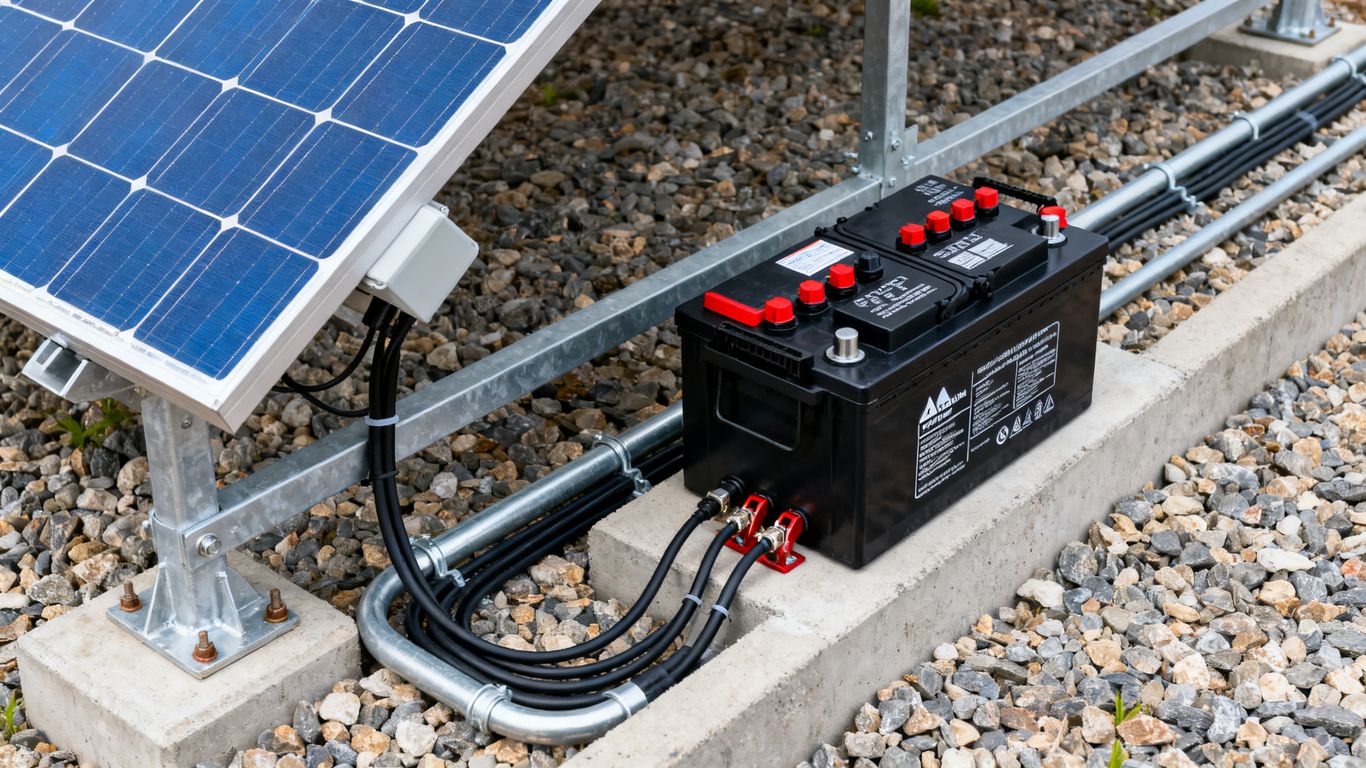
Applying the System Performance Ratio
It’s important to know that the electricity produced by your panels will not be entirely usable. There are losses to consider. These losses come from several things: the temperature of the panels, which can reduce their efficiency when it’s hot, dust that can accumulate, cables, and the inverter that converts the current. It is generally estimated that the overall efficiency of a system is between 75% and 85%. Therefore, the calculated power must be adjusted to compensate for these losses. A simple formula to estimate the required peak power (Pc) is: Pc = (Daily Consumption x 1) / (Minimum Sunshine x System Efficiency). For example, if your consumption is 11 kWh/day, the minimum sunshine is 1.5 kWh/m²/day, and the efficiency is 0.8, you would need about 9 kWp. Of course, this is an estimate, and it’s always good to consult a professional for an accurate calculation.
Here is a table that gives an idea of the annual production for different peak powers:
| Peak Power (kWp) | Estimated Annual Production (kWh/year) |
|---|---|
| 1 kWp | ~900 to 1,200 kWh/year |
| 3 kWp | ~2,700 to 3,600 kWh/year |
| 6 kWp | ~5,400 to 7,200 kWh/year |
| 9 kWp | ~8,100 to 10,800 kWh/year |
Determining Factors for Solar Panel Power per m²
It’s important to understand that the power advertised for a square meter of solar panel is a reference value, often measured under ideal conditions. Actual production can vary. Several elements come into play and directly influence the amount of electricity your panels can generate.
Impact of Panel Technology and Efficiency
The technology used in the manufacturing of photovoltaic cells is a key factor. Monocrystalline panels, for example, generally have higher efficiency than polycrystalline or thin-film panels. Efficiency, expressed as a percentage, indicates the proportion of sunlight converted into electricity. A panel with higher efficiency will produce more energy for the same surface area.
- Monocrystalline panels often offer the best performance.
- Polycrystalline panels represent a good compromise between cost and efficiency.
- Thin-film panels are more flexible but have lower efficiency.
You also need to consider panel aging. Over time, their production capacity slightly decreases, a phenomenon called linear degradation. Manufacturers take this into account in their warranties, but it’s a factor to keep in mind for long-term estimates.
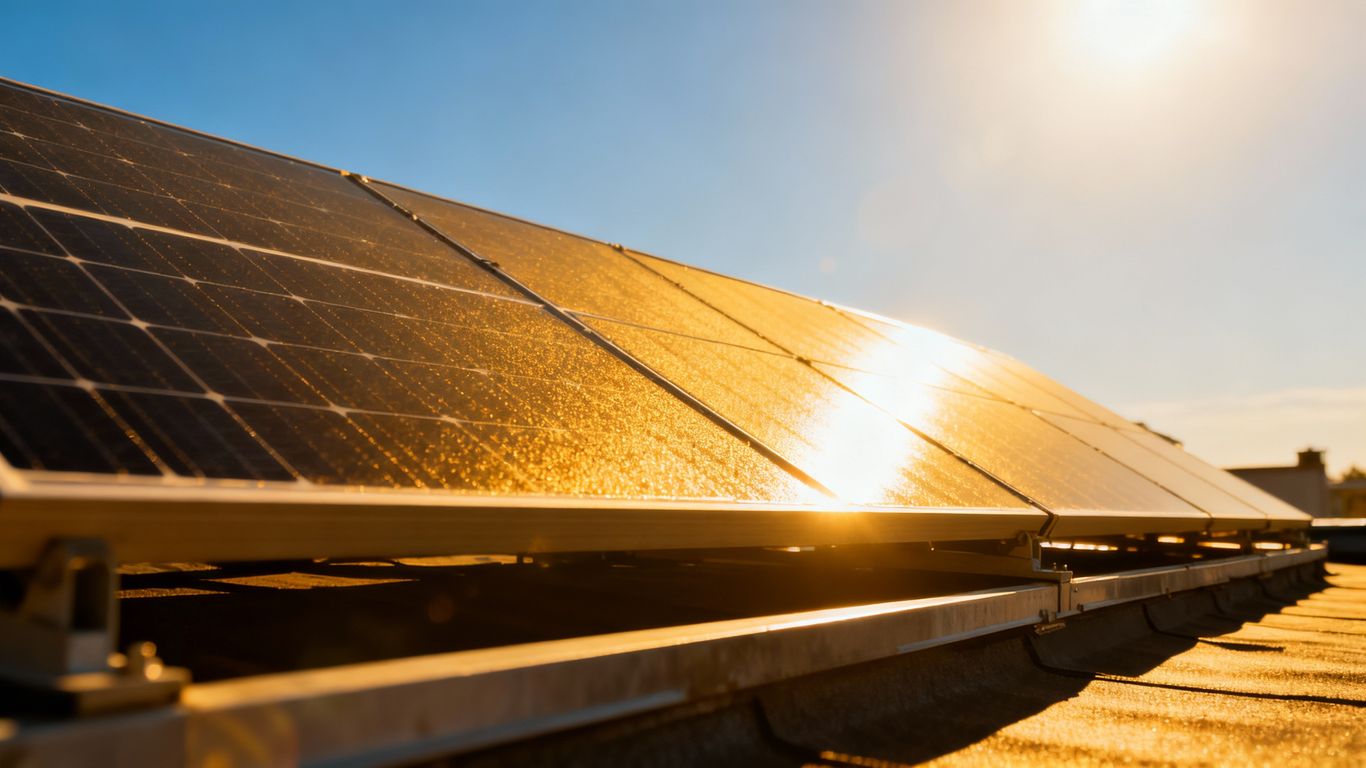
Influence of Local and Regional Sunshine
Where you live has a major impact on your solar panels’ production. Sunshine is not the same everywhere in France, nor in the world. Southern regions benefit from more intense and longer solar radiation than northern regions. Consequently, an installation of the same power will produce more electricity in the south than in the north. It is therefore essential to take into account the sunshine level of your region to estimate actual production.
Peak power (Wp) is a standardized measurement under laboratory conditions. Actual production (in Wh) will depend on your geographical location and weather conditions.
Importance of Panel Orientation and Tilt
The orientation of your panels relative to the sun and their tilt are also crucial. Ideally, panels should face south and have a tilt that optimizes the capture of solar rays throughout the year. A southeast or southwest orientation remains very efficient. A tilt that is too low or too high can reduce the amount of energy produced. The right balance must be found to maximize production. For example, a tilt of about 30 to 35 degrees is often recommended in mainland France for optimal exposure.
Here are some points to consider for orientation and tilt:
- Orientation: South is ideal, but southeast and southwest are also very good.
- Tilt: A tilt between 30° and 35° is generally optimal in France.
- Shading: Avoid shading from trees, chimneys, or neighboring buildings as much as possible, as even partial shade can significantly reduce production.
These factors, combined with your panel technology and your region’s sunshine, will give you a more accurate picture of the actual power you can expect from your solar installation.
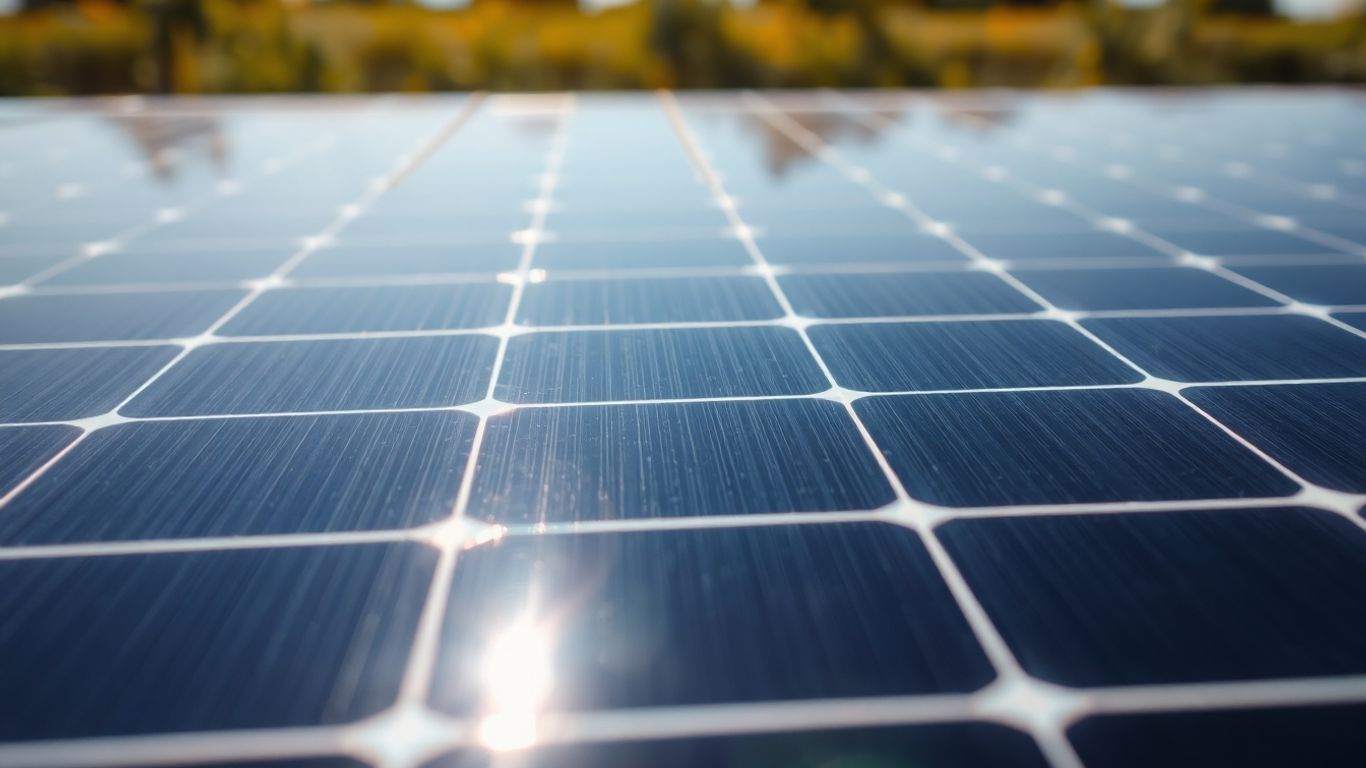
Sizing Solar Panels and Their Surface Area
Average Surface Area of a Standard Solar Panel
When we talk about solar panels, we often imagine a fairly standard size. Generally, a typical photovoltaic panel measures about 1.7 square meters (for example, 1.70 m x 1 m). Of course, there are variations; some models may be slightly larger or smaller, but this is a good basis for visualization. A panel’s power, expressed in Watt-peak (Wp), is directly related to its surface area and its efficiency. It is estimated that about 5 m² is needed to install 1 kWp of power, but this can change depending on the panel technology.
Electrical Power Available per Panel Size
The power of a solar panel, measured in Watt-peak (Wp), depends on several factors, including its surface area and the efficiency of its cells in converting sunlight into electricity. For a standard-sized panel (approximately 1.7 m²), you will generally find power outputs ranging from 300 Wp to over 400 Wp in 2025. Larger panels or those using more advanced technologies can achieve even higher power outputs. It’s important to note that the indicated power is measured under ideal laboratory conditions (called STC: 1000 W/m² irradiance, 25°C cell temperature, and an air mass of 1.5). In reality, production will often be slightly different.
Annual Production for Different Panel Sizes
The annual production of a solar panel, or an entire installation, depends on its total power (in kWp) and the sunshine in your region. To give you an idea, one square meter of solar panel can produce between 200 and 280 kWh per year, according to estimates. This means that a 3 kWp installation, which might require about 15 m² of panels, could produce between 3000 and 4200 kWh per year, depending on your geographical location (more in the south, less in the north of France). A 6 kWp installation (about 30 m²) could produce between 6000 and 8400 kWh annually.
It is essential to understand that these figures are estimates. The actual production of your solar panels will be influenced by many factors, such as the orientation of your roof, its tilt, shading, outdoor temperature, and even regular maintenance of your panels. A personalized assessment by a professional is therefore always recommended to obtain an accurate estimate.
Here is a simplified table to illustrate:
| Panel Size (approx.) | Typical Power (Wp) | Estimated Annual Production per Panel (kWh) |
|---|---|---|
| 1.7 m² | 350 Wp | 500 – 700 kWh |
| 2 m² | 400 Wp | 600 – 800 kWh |
These figures are for informational purposes only and may vary.
Optimizing Your Solar Installation’s Production
Once your photovoltaic installation is in place, it’s important to ensure it functions optimally to get the most out of it. Several simple actions can help you achieve this.
Using a Simulator to Estimate Production
Even before considering installation, or if you are thinking of expanding your system, an online simulator can give you a precise idea of what to expect. By entering information about your home, its location, and your consumption habits, these tools calculate the potential annual production. For example, a simulator might indicate that a 150 m² house in Grenoble, consuming a lot of electricity for heating and hot water, might require a 6 kWp installation to produce about 8,000 kWh per year. This represents a significant increase in self-sufficiency and can help you adjust the size of your installation to perfectly match your needs.
Monitoring Photovoltaic Installation Performance
To know if your installation is working as expected, it’s essential to monitor its production. Dedicated applications, often provided by installers or inverter manufacturers, allow you to view in real-time, hour by hour, day by day, or month by month, the amount of electricity your panels are generating. This regular monitoring allows you to quickly detect any unusual drop in performance. If you notice a drop in production, it could indicate a problem, such as dirt buildup or equipment malfunction. Knowing when your panels produce the most also helps you better plan your energy consumption.
Tips for Maximizing Energy Autonomy
To truly benefit from your solar installation, the goal is to consume the electricity you produce as much as possible. Here are some ideas:
- Annual Cleaning: Dust, fallen leaves, or pollution can reduce your panels’ production by up to 15%. Simple cleaning with plain water, once a year, is often enough to restore optimal efficiency. Ensure safe access to the panels if you do it yourself, or hire a professional.
- Consumption Management: Use periods of high solar production to run your most energy-intensive appliances (washing machine, dishwasher, water heater). Some smart systems, called energy managers, can automate this for you, thereby increasing your self-consumption rate.
- Orientation and Tilt: While a south-facing orientation with a tilt of about 30° is often ideal, it’s good to know that seasonal adjustments to the tilt (steeper in winter, flatter in summer) can theoretically improve production. However, for most fixed installations, the goal is an annual compromise.
Regular maintenance and consumption adapted to production are key to ensuring your solar installation provides you with maximum long-term benefits. Do not underestimate the impact of these simple actions on your electricity bill.
In Summary: What Power for 1 m² in 2025?
In conclusion, pinpointing an exact figure for the power of a square meter of solar panel in 2025 is complex, as it depends on many factors. However, as we’ve seen, we can expect a square meter to produce an average of 150 to 200 Wp under optimal conditions. Remember that this figure is just a starting point. For an accurate estimate of your needs and your installation’s potential production, it is always best to consult a professional. They can analyze your specific situation, from your region’s sunshine to your roof’s orientation, to propose the most suitable solution.
Frequently Asked Questions
What is the average power of a square meter of solar panel?
Generally, a square meter of solar panel can produce between 150 and 200 Watts-peak (Wp). It’s as if each square meter had a small power plant capable of transforming sunlight into electricity. Think of it as the maximum power the panel can provide under perfect conditions.
How do I know how many solar panels I need?
To know how many panels you need, you first need to look at your usual electricity consumption. Then, you need to consider the amount of sunshine in your region, as this affects production. Finally, a small calculation that takes into account the overall efficiency of the system will help you find the right total power for your installation.
What causes the production of a solar panel to vary?
Several things can change the amount of electricity produced by a panel. The panel’s technology itself plays an important role, as does the amount of sun it receives (sunshine). The location where you place it, meaning its orientation and tilt, is also very important for capturing maximum sunlight.
What is the difference between maximum power and peak power?
Maximum power is the absolute best, the highest production a panel can achieve when all conditions are absolutely perfect, like in a laboratory. Peak power is a bit the same idea; it’s the maximum power measured under standardized test conditions to easily compare all panels.
Does the weather affect my solar panels’ production?
Absolutely! Weather is a key factor. A sunny, cloudless day will allow your panels to produce much more electricity than a cloudy or rainy day. Temperature also plays a role: when it’s too hot, efficiency can slightly decrease compared to ideal conditions.
How can I estimate the annual production of my solar installation?
To get an idea of what your panels will produce each year, you can use an online simulator. It will take into account the total power of your panels, your region’s sunshine, and other factors. This will give you a fairly accurate estimate, but remember that actual production can vary slightly each year.